

- Introduction: Exploring Airbnb Property Earnings Metrics
- Key Metrics for Property Earnings
- Occupancy Rate
- Average Daily Rate (ADR)
- Revenue Per Available Room (RevPAR)
- Total Revenue
- Booking Lead Time
- Occupancy by Season
- Property Expenses
- Net Profit
- Booking Source Share
- Visualizing Data
- Conclusion
Introduction:
In the ever-changing landscape of the vacation rental industry, property owners, investors and Airbnb hosts are constantly looking for ways to increase the earning of their properties. In order to help clients achieve this goal we developed a comprehensive guide of key metrics for analyzing Airbnb property earnings. This guide helps you make data-driven decisions and provides valuable insights that will maximize your property’s financials.
Key Metrics for Airbnb Property Earnings:
1. Occupancy rate:
The occupancy rate is a essential metric for comparing the overall performance of your Airbnb belongings. It represents the share of time your property is booked and, through extension, the level of demand to your space. Understanding and optimizing this metric could have a enormous impact on your property earnings.
Definition: The occupancy rate is calculated by dividing the number of nights your property is booked by the total number of available nights in a specific time period. This percentage represents how often your property is occupied by guests.
Why it matters:
Maximizing Revenue: A high occupancy rate indicates that more visitors are spending time on your property, which boosts earnings. It's a clear sign of the demand for and possible revenue from your property.
Optimizing Pricing: By keeping an eye on the occupancy rate, you can modify your price plan. You can raise your prices during times of great demand, but you could also need to provide discounts to draw in more customers during slower periods.
Effective Marketing: Understanding your occupancy rate will enable you to evaluate the success of your marketing campaigns. If the occupancy rate at your property is consistently low, it may be time to review your advertising and promotion tactics.
Budget Planning: Knowing your occupancy rate is essential for property owners to plan ahead and make budgets. It makes it easier for you to more precisely project your income and expenses.
2. Average Daily Rate (ADR)
Definition: The average cost you charge per night for your Airbnb property is known as the Average Daily Rate (ADR).
Why it matters:
Revenue Impact: A higher ADR can significantly increase your earnings, making your property more profitable. You can ensure that each night your property is booked contributes more to your overall revenue by setting and maintaining an optimal ADR.
Competitive Positioning: A properly calibrated ADR also aids in the positioning of your property in the market. Pricing too low may imply lower quality, while pricing too high may deter potential guests. Finding the right balance can help you attract the right clients and increase bookings.
Pricing Strategy: ADR is an important part of your pricing strategy. You can maximize your property's income while remaining competitive by analyzing trends and adjusting your ADR based on factors such as season, demand, and local events.
Profitability: Increasing your ADR without sacrificing guest satisfaction or occupancy rates can have a significant impact on your bottom line.
Guest Experience: While revenue optimization is critical, it is also critical to provide fair value to your guests. Finding the right ADR balance can help to increase guest satisfaction, which can lead to positive reviews and repeat bookings.
3. Revenue Per Available Room (RevPAR)
Definition: RevPAR, or Revenue Per Available Room, is calculated by dividing your property's total revenue by the total number of available nights.
Why it matters:
Efficiency Indicator: RevPAR is an important indicator of how effectively your property is being used. It considers both occupancy rates and pricing, making it a comprehensive metric for assessing the financial performance of your property.
Comparative Analysis: By tracking RevPAR, you can easily compare the performance of your property to that of competitors in the market. This allows you to see how your property compares to others and where improvements may be required.
Pricing Strategy Optimization: Raising prices, increasing occupancy, or both are methods of increasing RevPAR. This metric can help you decide when and how to adjust pricing to maximize profits.
Market Trends: Following RevPAR over time can also reveal market trends. For example, if RevPAR is consistently increasing, it may indicate that demand in your area is increasing. A declining trend, on the other hand, could indicate increased competition or decreased demand.
Revenue Projection: RevPAR can be used to forecast future earnings. Understanding how revenue per available room is changing allows you to better plan your budget, marketing strategies, and property investments.
4. Total Revenue
Definition: Total revenue is the total income generated by your Airbnb property, which includes both nightly rates and any additional charges or services.
Why it matters:
Financial Performance: It gives you a complete picture of your property's earnings, including all sources of income.
Profit Assessment: It enables you to see how well your property is performing in terms of income generation.
Marketing and Promotion: Total revenue can help you evaluate the effectiveness of your marketing and promotional efforts. An increase in revenue might indicate that your marketing strategies are driving more bookings and boosting income.
Budget Planning: It gives you a clear picture of your income, allowing you to budget for property expenses, investments, and long-term financial goals.
5. Booking Lead Time
Definition: Booking lead time is the time between when a guest makes a reservation and when they arrive at your Airbnb property.
Why it matters:
Pricing and Demand Forecast: Understanding booking lead times is critical for optimizing pricing. Short lead times may indicate last-minute bookings, whereas longer lead times can assist you in forecasting future demand. You can maximize your earnings by adapting your pricing strategy to these patterns.
Resource Allocation: Booking lead times can inform how you allocate resources. For instance, if you often receive last-minute bookings, you may need to have a flexible cleaning schedule in place. Longer lead times allow for more extended planning and preparation.
Market Timing: It provides insights into seasonal variations. For example, you might notice that lead times increase during peak tourist seasons or in response to local events. This information can help you tailor your marketing efforts to specific periods.
Pricing Flexibility: If you observe patterns of shorter lead times, you may be able to capitalize on last-minute bookings by offering competitive rates to fill unbooked nights.
6. Occupancy by Season
Definition: Occupancy by season refers to the distribution of bookings and guest stays across different times of the year, typically categorized into seasons such as summer, winter, spring, and fall.
Why it matters:
Seasonal Planning: Understanding how bookings vary by season is vital for seasonal planning. It enables you to anticipate periods of high and low demand, adjust your pricing strategy, and make necessary preparations.
Pricing Strategy: Occupancy by season influences your pricing strategy. During peak seasons, you can charge higher rates, while off-peak seasons may require more competitive pricing to attract guests.
Marketing Focus: By recognizing the seasonal patterns, you can tailor your marketing and promotional efforts to target potential guests at the right time. For example, you can run special promotions during slower seasons to boost occupancy.
Guest Experience: By understanding seasonal occupancy, you can better prepare your property to meet the unique needs of guests during each season. For example, providing winter amenities during the cold months or outdoor equipment during the summer.
7. Property Expenses
Definition: Property expenses encompass all the costs associated with maintaining and operating your Airbnb property. These expenses can include utilities, maintenance, cleaning, property management fees, insurance, property taxes, and more.
Why it matters:
Profit Optimization: Understanding and tracking property expenses is essential for optimizing your property's profitability. By identifying where your money is being spent, you can make informed decisions to reduce costs and increase your bottom line.
Budget Planning: Property expenses are a core component of budget planning. By knowing your ongoing and potential expenses, you can set realistic financial goals and allocate resources effectively.
Return on Investment (ROI): Monitoring expenses helps you assess the ROI on your property. By evaluating how much you're spending in relation to your earnings, you can make strategic decisions about your property investment.
Tax Deductions: Property expenses can often be tax-deductible, reducing your overall tax liability. Understanding the expenses that qualify for deductions can lead to significant savings.
Maintenance and Guest Satisfaction: Properly managing property expenses ensures that your property remains well-maintained and in good condition. This, in turn, contributes to guest satisfaction, positive reviews, and repeat bookings.
8. Net Profit
Definition: Net profit is the final financial outcome for your Airbnb property, representing the income generated from your property after deducting all associated expenses.
Why it matters:
Financial Success: Net profit is the ultimate indicator of your property's financial performance. It tells you whether your property is operating at a profit or a loss.
ROI Assessment: Net profit allows you to assess the return on investment (ROI) from your property. It shows whether your property is delivering a satisfactory return on the resources and capital invested.
Goal Achievement: Net profit is a key metric for assessing whether your property is meeting your financial goals. It's a fundamental measure of your property's economic viability.
Resource Allocation: By understanding your net profit, you can make informed decisions about resource allocation, such as investing in property improvements, expanding your portfolio, or considering alternative investment opportunities.
Tax Reporting: Net profit is often a key figure for tax reporting purposes, and understanding this metric is crucial for fulfilling tax obligations.
9. Booking Source Share
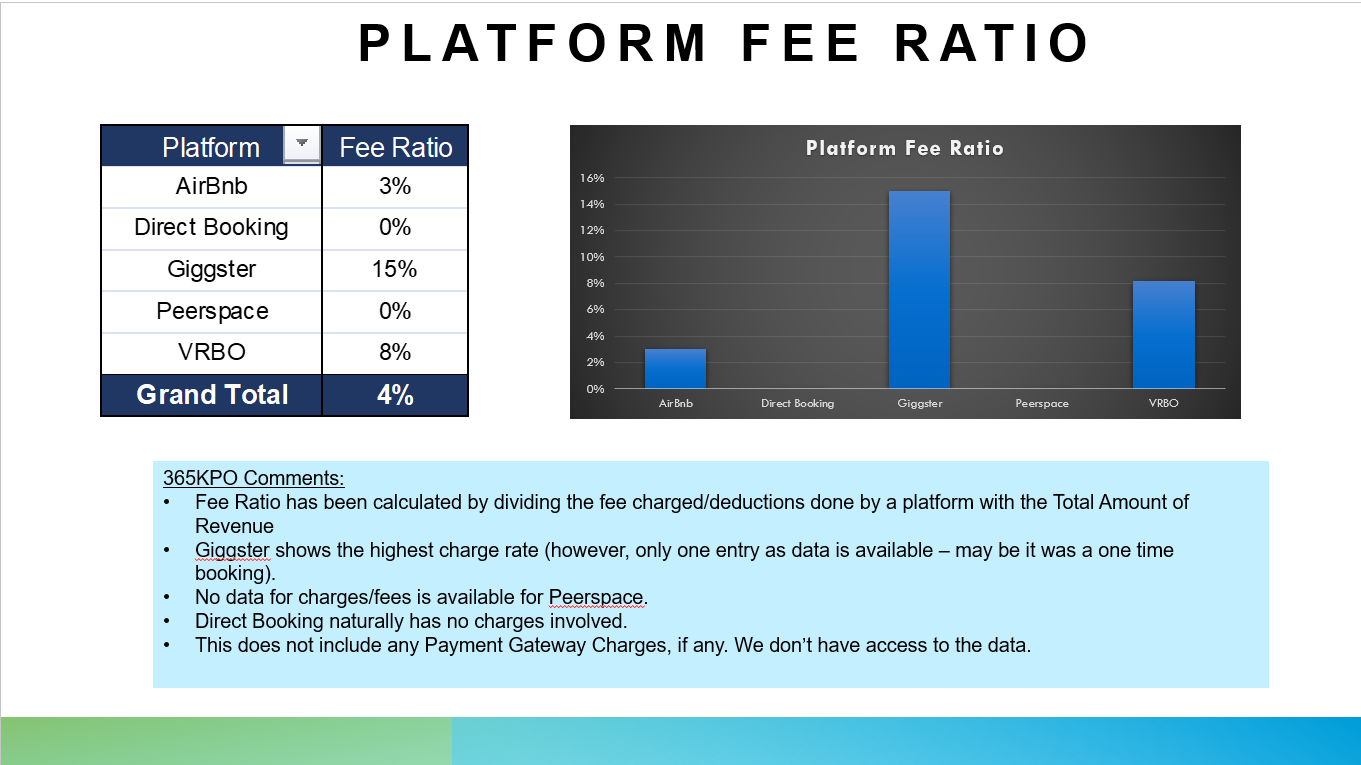
Definition: Booking Source Share is a metric that indicates the percentage of bookings for your Airbnb property that originate from different platforms or sources, such as Airbnb, VRBO, Booking.com, or direct bookings.
Why it matters:
Diversification: Understanding the share of bookings from different sources helps you diversify your booking channels. This reduces your dependence on a single platform and mitigates risks associated with platform-specific fluctuations.
Revenue Streams: By tracking the booking source share, you can assess the performance of different platforms. This information allows you to allocate resources more effectively and focus on platforms that generate the highest revenue.
Market Strategy: Recognizing where your bookings come from can influence your marketing and promotion strategies. It enables you to tailor your efforts to target specific platforms or channels that have the potential for growth.
Guest Acquisition Costs: Different booking sources may have varying acquisition costs. By monitoring booking source share, you can evaluate the cost-effectiveness of each channel and make informed decisions about marketing expenses.
Adaptation: Understanding your booking source share helps you adapt to changes in the market, as shifts in the distribution of bookings may signify evolving guest preferences and behaviors.
Graphical Representation:
To make these metrics more understandable, we have created a graphical representations of the property's earnings data. These visuals include charts, graphs, and tables that offer a visual overview of how a property is performing over time.


Conclusion:
365KPO Services is dedicated to helping you maximize your Airbnb property earnings. By closely monitoring these key metrics you can gain a more profound understanding of your property's financial performance. These tools will empower you to make data-driven decisions, optimize your property management, and ultimately enhance your earnings in the competitive vacation rental market. Start using these resources today to unlock the full potential of your Airbnb properties.


